Hospital metrics are tracked in multiple different ways by the state of Georgia. Two of the most commonly cited numbers are currently hospitalized and total hospitalized. They are two completely different numbers that come from different sources, so I thought it would be helpful to explain what I know about these metrics. There are also separate metrics that hospitals report to the US Dept of Health & Human Services, which I track here for all US states.
Currently Hospitalized
This tracks the number of people currently in the hospital with an active COVID infection, as reported by hospitals. This data comes from the Georgia Medical Facility Patient Census site, where it is viewable for the state overall, as well as by hospital region. This number includes anyone in the hospital who is positive for COVID, whether you were tested at the hospital or not, and whether you are hospitalized for COVID or another reason (labor & delivery, broken bone, etc.)
It also includes a separate number for “patients under investigation” for COVID (awaiting testing). This number is typically low in most regions except for Region N (Cherokee/Cobb/Douglas/Paulding), so I suspect the Wellstar hospital system based there reports this number differently. These numbers match pretty closely with the HHS hospitalization numbers in general, though reports of HHS numbers often combine confirmed and suspected, so be sure to look for that distinction.

Hospital Overall Capacity Numbers
Hospitals report exactly how many ER beds, ICU beds, and the general hospital beds are occupied each day by all patients (not just COVID-related patients). This data comes from the Georgia Hospital Bed/Ventilator Use site, where it is viewable for the state overall, as well as by hospital region.
They also calculate and report state-wide occupancy totals and percentages of these beds daily. While a couple of smaller regions sometimes get very low on ICU beds, there is excess capacity in other regions where patients could be transferred if needed.
Complete data on current hospitalizations in Georgia is updated daily on my Current Hospitalizations page.
Hospitalized Total on DPH site
According to the DPH Status Report definitions PDF:
“Hospitalizations: Defines the count of confirmed cases in which the patient was hospitalized at the time of reporting to DPH. Because of how this number is reported to DPH, it may be underreported. This number does not represent the number of confirmed COVID-19 cases currently hospitalized.”
This number is cumulative, so it only ever goes up. Many people track this number and report on the increase each day, but I have steered away from this, because this number has often fluctuated wildly, and based on how it is collected and the lag in reporting, I am not certain how valuable it is.
As the definition above states, it is based on the patient’s hospitalization status “at the time of reporting to DPH”. Another epidemiologist clarified to me that it means the person was hospitalized at the time their test was administered. That is not the same as requiring hospitalization for COVID. Based on that definition:
- It DOES NOT INCLUDE anyone who was tested at an outside lab, who then required hospitalization for COVID.
- But it DOES INCLUDE anyone who tested positive for COVID while in a hospital for a reason other than COVID.
Finally, because this count is based on confirmed case reports sent in by labs, and not on patient counts submitted by hospitals, there is a reporting lag. There are dips every weekend when less lab reports come in (it does not mean less patients are admitted to hospitals on the weekend), and then high numbers early in the week when they catch up from the weekend.
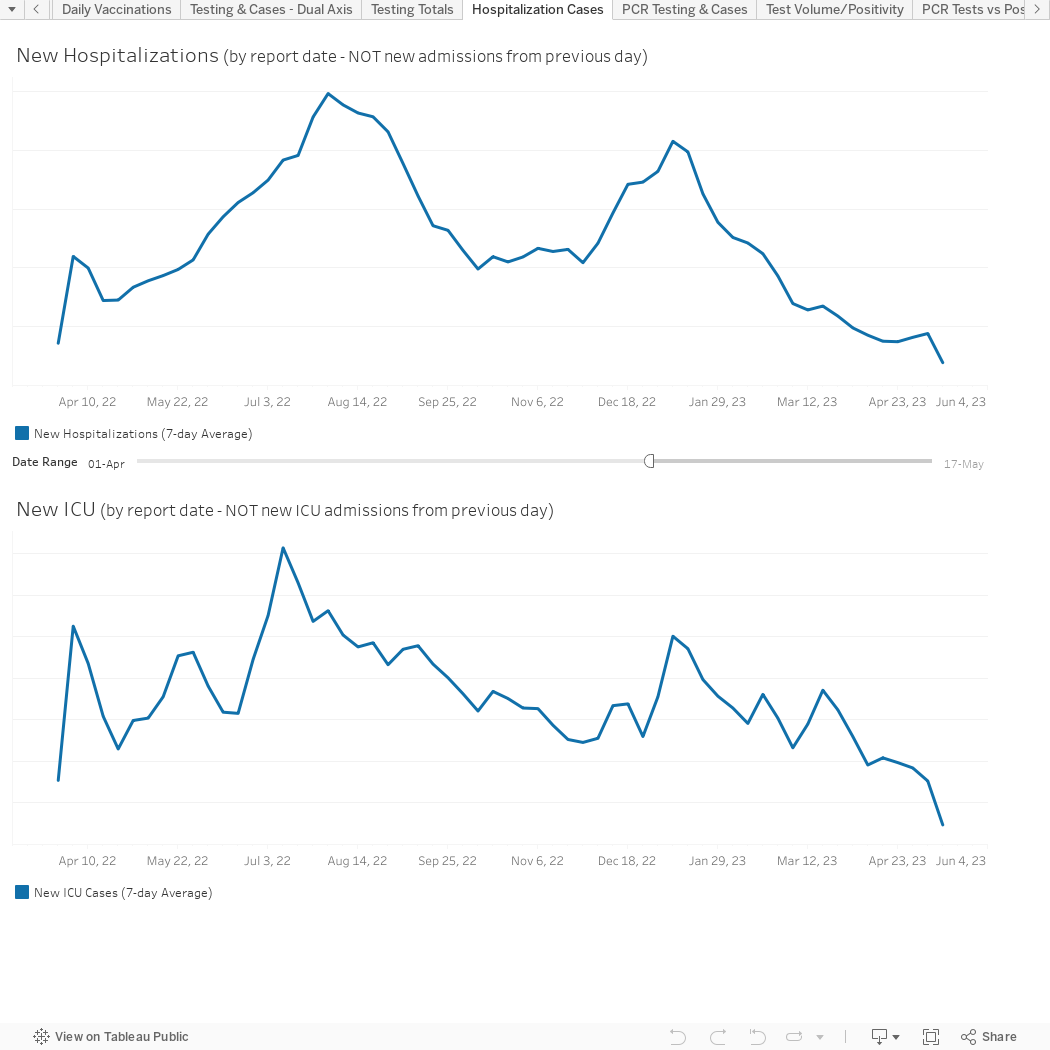
I track the daily change in total hospitalizations from this number, as well as the daily change in the total ICU cases from the GA DPH site, and I have a graph for that below. You can see some general trends from this, but don’t rely on this too much, as it seems the data from GA DPH is poor based on incomplete data and reporting lags.
For more accurate data on daily admissions, see the HHS new admissions graph on the CDC web site, and filter for Georgia. I also have a graph for weekly new admissions per 100K based on the HHS data, but I list only the top 10 states in the US for this metric, so if GA is not shown, they aren’t in the top 10.